🎄12 Days of HPC 2022
AI is not just for Christmas: Using image-recognition to analyse exoplanetary atmospheric models.
During the month of December we’re featuring blog posts from researchers from across the University of Leeds showcasing the fantastic work they do using our High Performance Computing system. Follow us @RC_at_Leeds to keep up to date with our 12 days of HPC blog series.
What’s your name?
Felix Sainsbury-Martinez
What department do you work in?
Physics (Astrophysics)
What research question are you trying to answer?
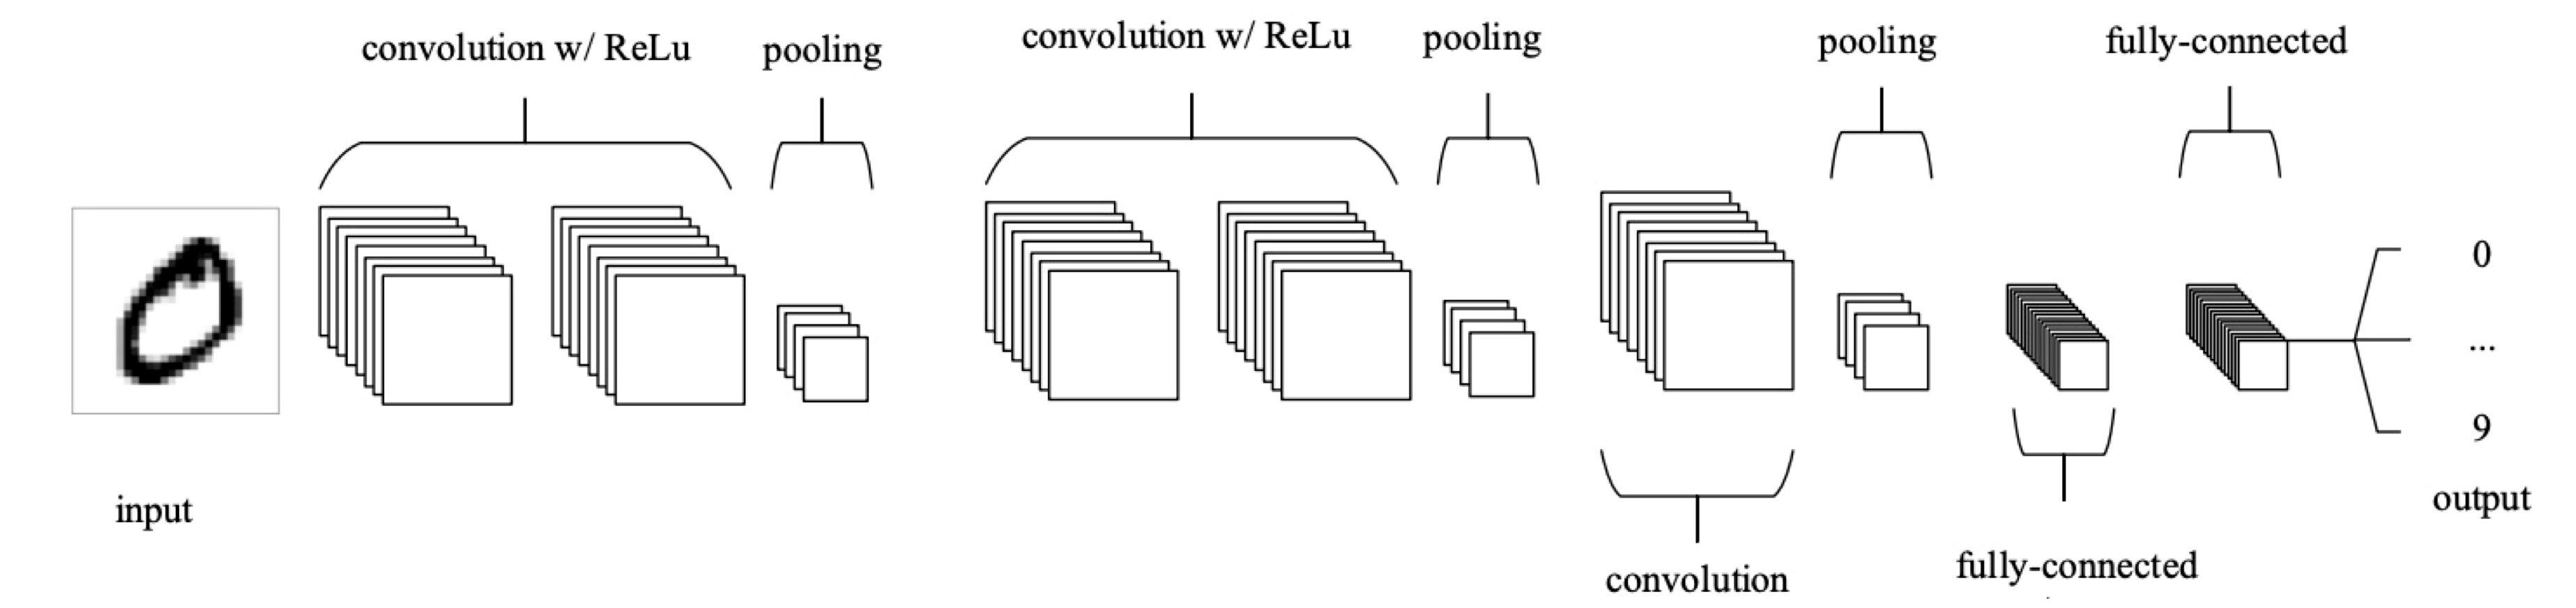
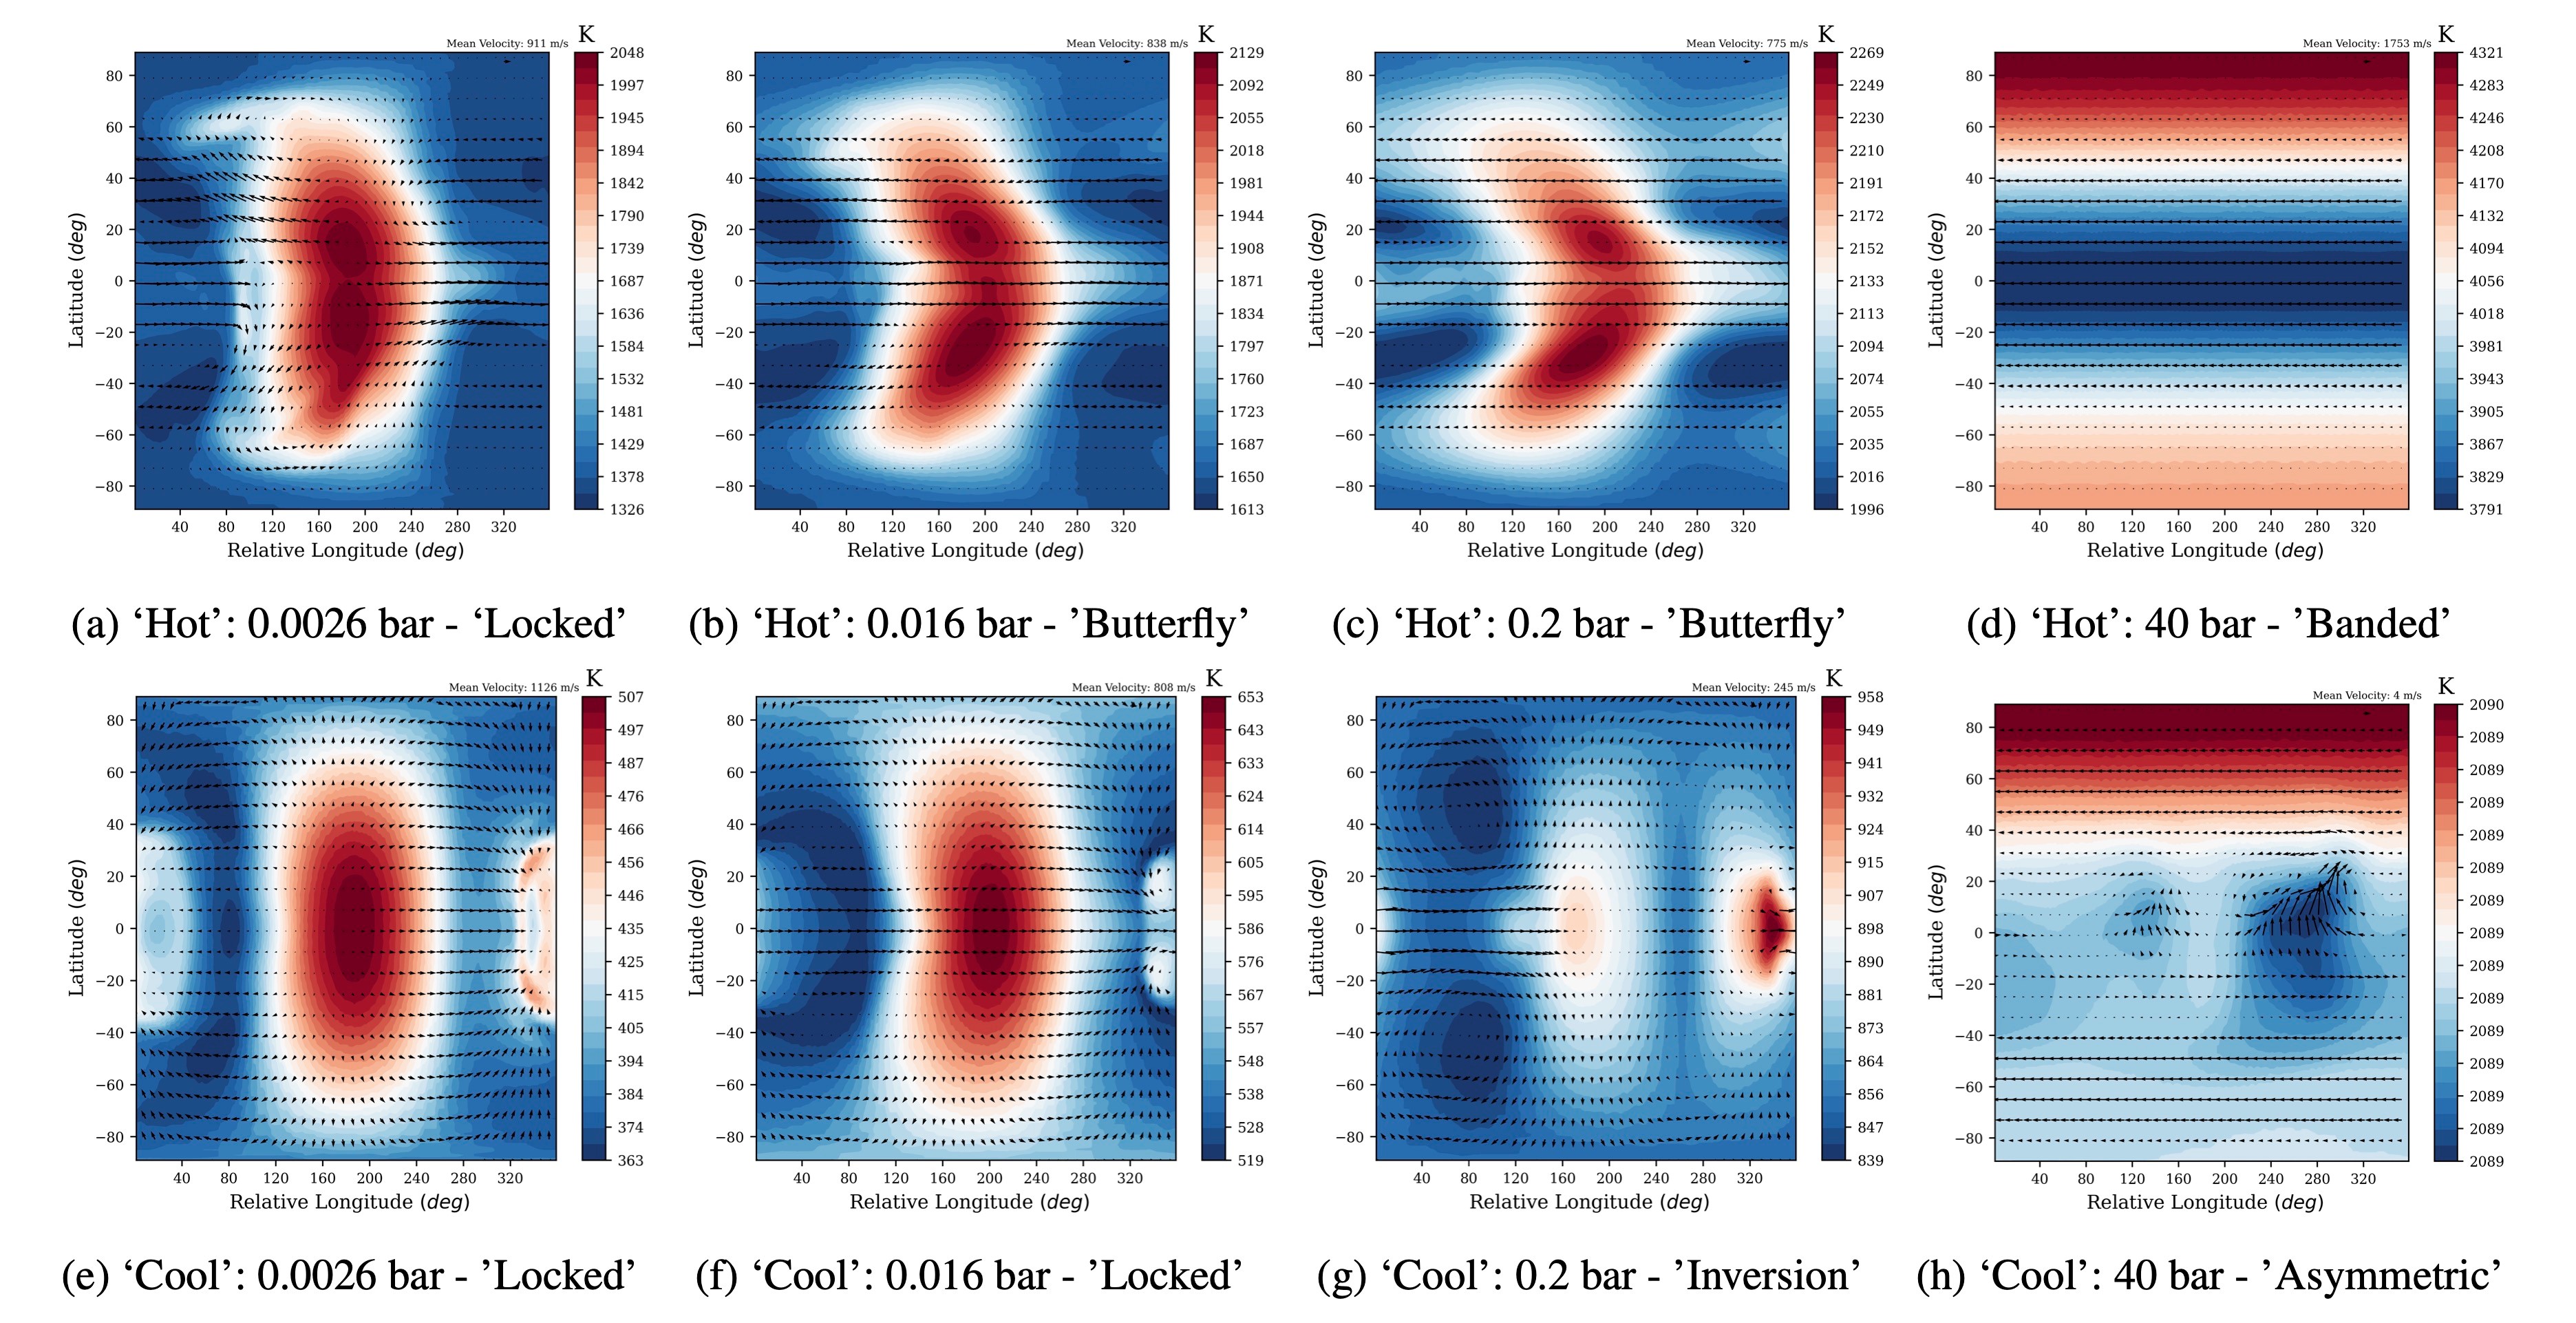
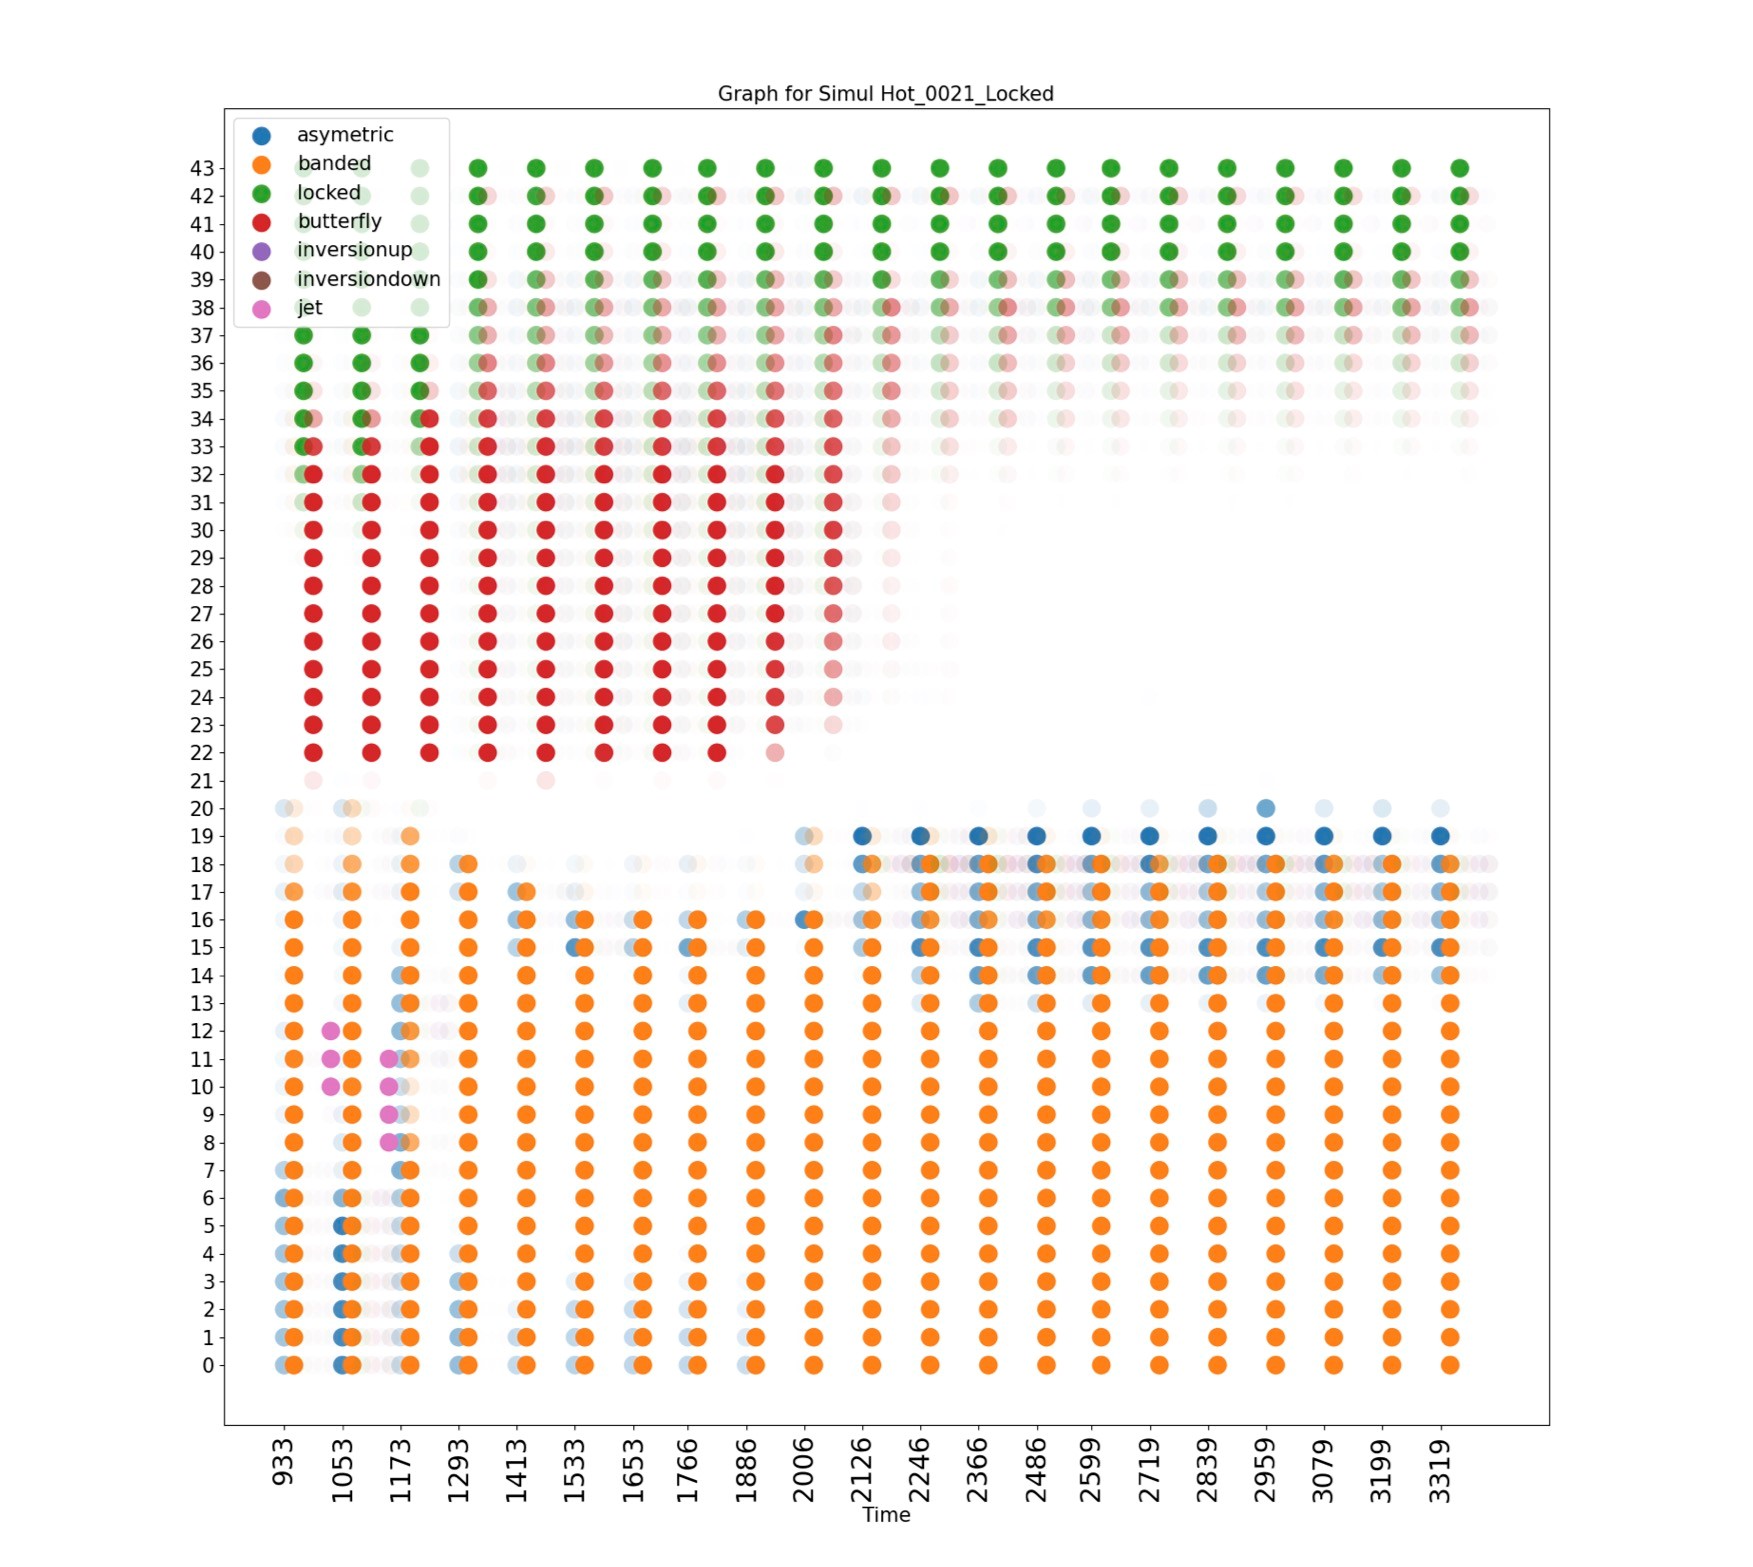
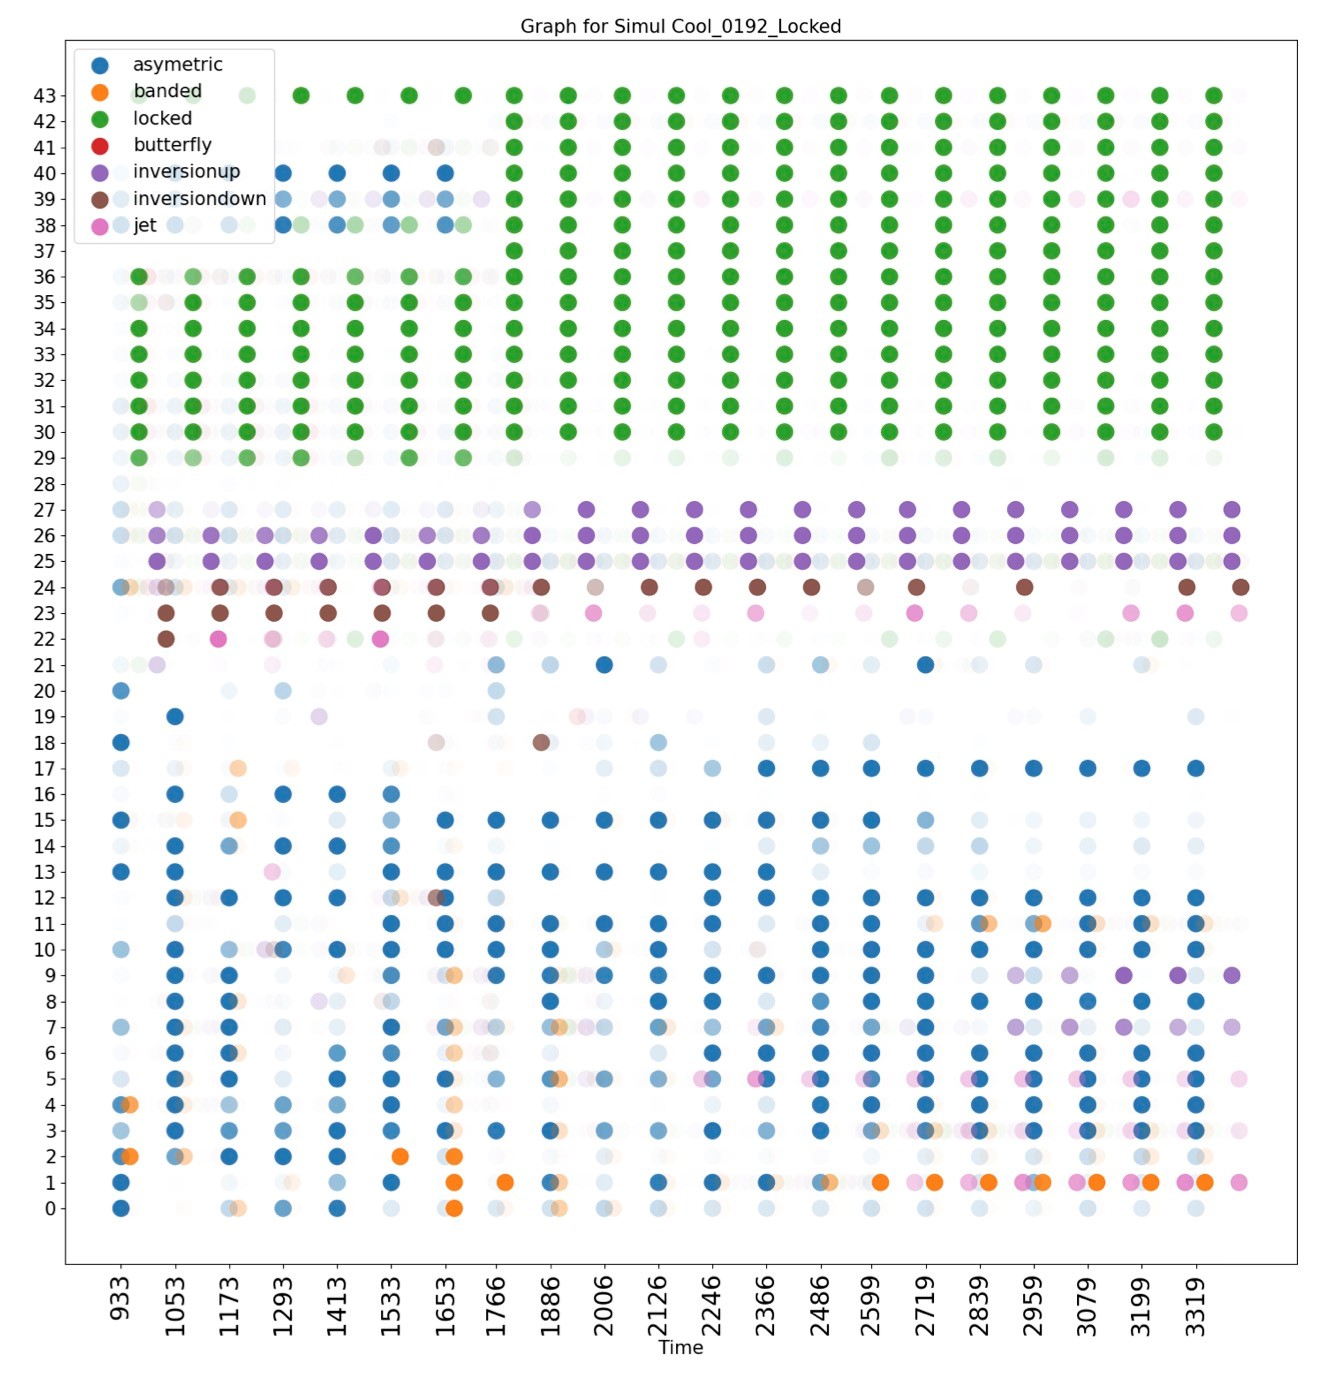
Next-generation atmospheric models are becoming increasingly large, with both model resolutions increasing, as well as model complexity, as additional dynamics, such as multi-stream radiative transfer and non-equilibrium chemistry, are required to understand high-resolution exoplanet observations from, for example, JWST. We investigate if AI, specifically image-recognition, could be used to reduce the researched workload and autonomously post-processes simulation result.
What tools or technologies do you use in your research? (Programming languages, packages, APIs)
Our models where run using the GCM DYNAMCIO, which is written in Fortran and which is compiled using the legacy Intel fortran compiler, Intel MPI, and Intel MKL. It also links against XIOS, which is an IO library for GCMs which converts the models grid to a user-readable output, at run-time, and stores this output in netCDF files. Our AI image-recognition models are based upon the Keras Convolution Neural-Network which is implemented as part of TensorFlow.
How does HPC help your research?
As a computational astrophysicist, HPC is at the very heart of my work. For example, without HPC, the atmospheric models which where used to train the image-recognition models would not have been possible. For example, the models used here required over 2 million cpu hours to equilibrate, and other proper models, upon which these are based, have required even longer.
What is the potential impact of your research?
Whilst our study was limited to analysing exoplanetary atmospheric models, the underlying methodology is also applicable to models of the Earths atmosphere, an area of obvious interest, especially given how many models of the Earths atmosphere are run every single day. Given that amount of data that all these models of both the Earth and exoplanets generates, any methodology which could decrease the work required to analyses them is incredibly valuable.
In your personal opinion what’s the coolest thing about your research?
I love how models allow us to explore the universe in ways that would otherwise be impossible. In particular, my research is focused upon hot Jupiters (imagine a Jupiter size planet orbiting closer to the sun than Mercury), objects which do not exist in our solar-system, and which can only be understood though a combination of observations (using high power telescopes) and models. Furthermore, by using Earth models to model the atmospheres of these more unusual objects, we can push the models to more extremes, thus also improving the accuracy of the model when exploring the Earths atmosphere.
Postscript
The paper detailing the above work has been submitted to A&A and should hopefully be available soon. Examples of the wind dynamics seen in our atmospheric models can be found online at https://www.youtube.com/watch?v=s-7AXs5_owg and https://www.youtube.com/watch?v=toDpbqer2e4.