You don’t always know what matters in your data until you can explore it visually with your team. But when datasets are large and complex, the tools to support that kind of collaborative exploration often don’t exist.
This was a challenge faced by Professor Julie Aspden and her team in the School of Biology. They study ribosomes (the cellular machines that make proteins) using complex 3D structural data and needed to visualise and compare multiple structures side by side. While existing visualisation tools each offered useful features, they were struggling to find a single tool which met all their requirements.
Recognising they’d need custom software development, Julie reached out to the Research Computing team for consultancy support while preparing their Engineering and Physical Sciences Research Council (EPSRC) funding application. This early conversation helped them budget for Research Software Engineer (RSE) support and additional data storage. It also laid the groundwork for a partnership that would span the entire project.
How we worked together
Once funded, the team worked with Andy Turner, one of our RSEs. He evaluated existing visualisation tools – including Mol*, a modern open-source toolkit for molecular visualisation. After developing and testing prototypes with the team through a codesign workshop, Andy integrated the best functionalities into a new platform.
Andy brought interdisciplinary thinking to the project, asking questions that helped the researchers envision possibilities they hadn’t considered. What started as a request for a comparison tool evolved into a flexible platform that could serve the broader ribosome research community.
What made it work
The success of this collaboration hinged on a trust-based relationship built and maintained over time.
In interdisciplinary collaborations, both sides speak different languages. Researchers and software developers use different terminology and think about problems differently. This mutual trust and open communication proved essential, allowing each side to let go of what they didn’t understand, confident the other would handle it.
What was achieved
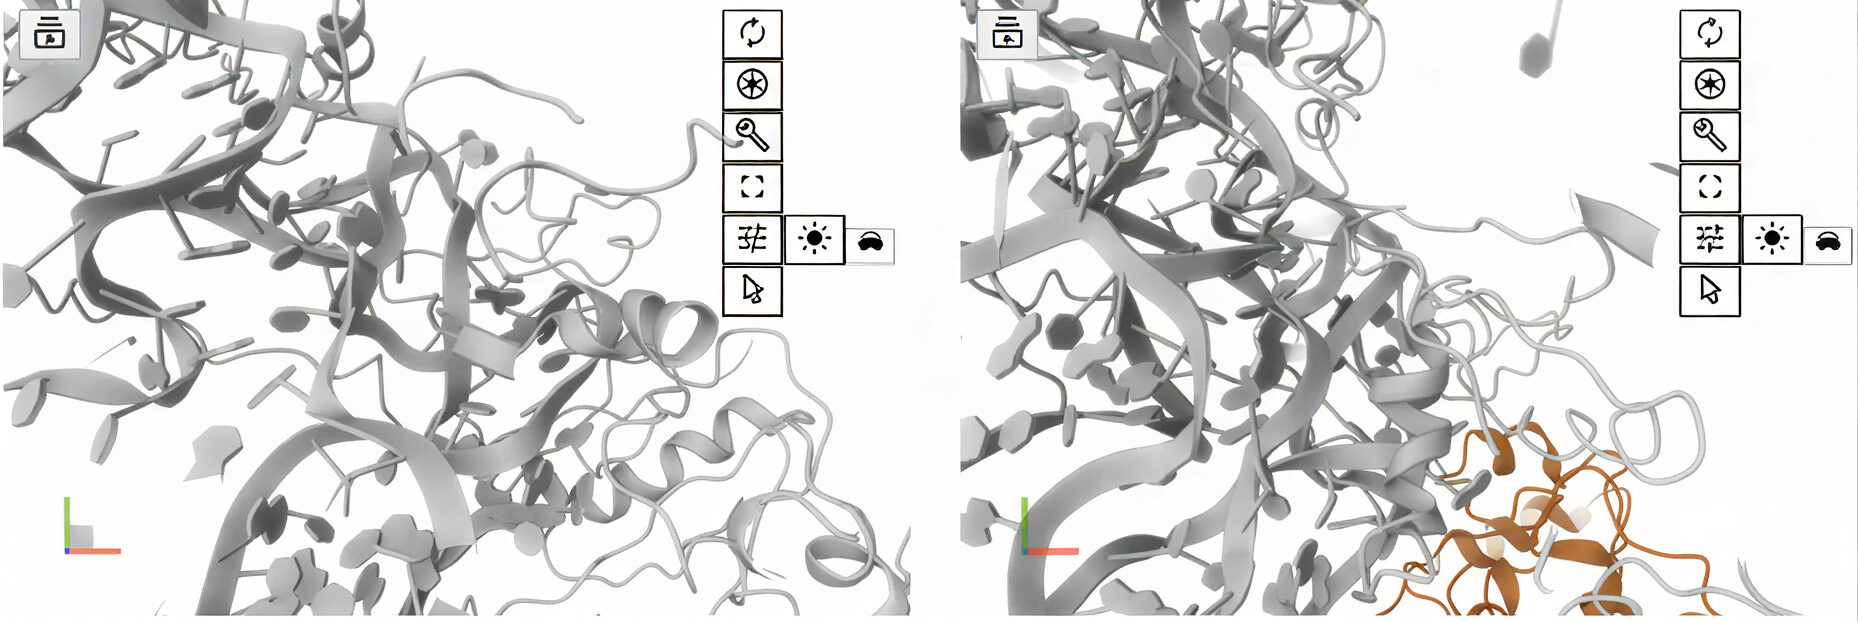
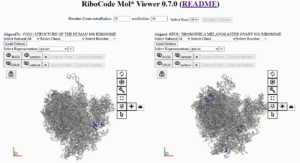
Ribocode is now an open source web based tool that lets researchers visualise and compare ribosome structures side by side.
Key capabilities:
- Works offline
- Protects unpublished data
- Can be easily deployed for different research groups
The collaborative development process revealed features and approaches the team hadn’t initially considered. This opened new avenues for their research questions.
The strength of the partnership was evident when the team invited Andy to demo the Ribocode tool at their Scientific Advisory Board (SAB) meeting. The board’s positive response demonstrated both the tool’s value and validated the RSE partnership model.
The story continues
Andy continues to work with Julie’s team into a second phase of development. Right now, they are refining the tool based on user feedback and preparing it for the wider community. With RSE support, Julie’s team can feel confident sharing the Ribocode tool more widely, knowing that the code base is properly licensed, documented, and ready for others to use and build upon.
What this could mean for your research
RSE partnerships can be woven throughout your project’s lifespan:
- Early engagement during funding applications helps you plan realistically and strengthens your case
- Collaborative development during your project can reveal possibilities you haven’t imagined yet
- Ongoing partnership ensures your outputs can benefit the wider community
If you’re working with complex data, custom visualisation needs, or computational challenges, an RSE brings technical expertise and fresh perspectives.
In our experience, the earlier you start that conversation, the better the outcomes.
I would do it again in a heartbeat. On any project where you know you will have big data, it would be non-sensical not to factor RSE support into your project proposal.
Dr Julie Aspden
Technical Details
Technology Stack:
TypeScript, React, Mol*, Node, Vite, deployed as Progressive Web App via GitHub Pages
Key Features:
- Side-by-side 3D molecular visualization
- Independent rotation/zoom controls
- Customizable styling and representations
- Dataset alignment algorithms
- Synchronized viewing
- Offline capability
- Open source foundation
Source Code:
Team:
- Principal Investigators: Julie Aspden, Juan Fontana
- Research Team: Mary O’Connell, Alan Beavan, Bulat Fatkhullin
- Research Computing: Patricia (project management), Andrew (data wrangling), Andy (development)
Cover image attribution: Visualisation created using Mol*
Ready to discuss your project?
Whether you have detailed plans, want help costing RSE support into a grant proposal, or you’re just exploring what’s possible, log a Research Computing Query and we’ll help you figure out next steps.