
Optimisation is most effective when it is guided by evidence. Premature optimisation can waste time, but leaving performance analysis until the end can make problems much harder to fix. Performance tools help identify the parts of an application that matter most, allowing optimisation effort to be focused where it will have the greatest impact.
Making better use of HPC resources
Modern scientific applications often run across multiple CPU cores, GPUs, or cluster nodes. As systems become increasingly parallel, performance begins to depend not only on the amount of hardware available, but also on how effectively an application distributes work, communicates between processes and uses the underlying architecture.
Identifying performance problems is not always straightforward. From a user’s perspective, the only sign of a problem may be that a job takes longer than expected to complete.
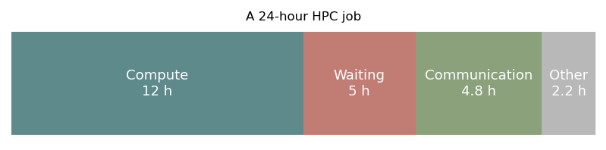
Performance-analysis tools can help answer these questions by showing how an application behaves while it is running. They can identify bottlenecks, reveal communication overheads and highlight opportunities for optimisation.
Asking the right questions
Performance analysis is often a process of asking increasingly specific questions about an application. If a job takes longer than expected to complete, the first step is to identify where time is being spent.
Once a bottleneck has been identified, the next question is why it is occurring. Is the workload distributed evenly between processes? Are some processors sitting idle while others work? Is communication becoming a limiting factor?
It is also important to understand how performance changes as a simulation grows. A code that performs well on a few processors may behave very differently at larger scales.
Profiling: where is the time being spent?
Figure 2 shows a simple MPI test application consisting of four computational loops followed by a communication phase. The application is presented in two variants: a balanced version and a deliberately imbalanced version. Score-P was used to record performance data, measuring the time spent in different regions of the application as it ran.
In the first case, all processes spend a similar amount of time computing and reach the communication step together. In the second case, some processes finish their work much earlier than others and spend time waiting. Although all processors are allocated for the duration of the job, a significant fraction of that time is not being used productively.
Profiles such as these provide a quick overview of application behaviour and can help identify where performance is being lost. In larger applications, profiling can help researchers focus optimisation efforts where they are most likely to have an impact. If a potential bottleneck is identified, more detailed investigation can then be focused on the relevant part of the code.
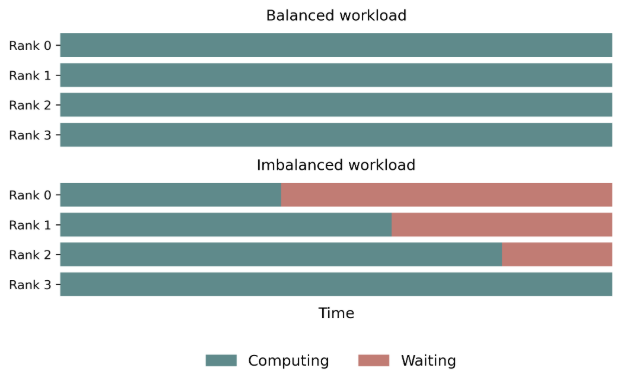
The rest of this article uses the imbalanced run of the test application to illustrate how different performance analysis tools identify the source of the inefficiency and suggest opportunities for improvement.
Trace analysis: why time is lost
A profile can tell us where time is being spent, but it does not always explain why. In the imbalanced variant of the test application, different MPI processes perform different amounts of work. Some processes therefore reached the communication phase earlier than others.
Tracing records the sequence of events that occur during program execution, showing when each process is computing, communicating, or waiting. This makes it possible to see how processes interact and whether some are spending time idle while waiting for others to catch up.
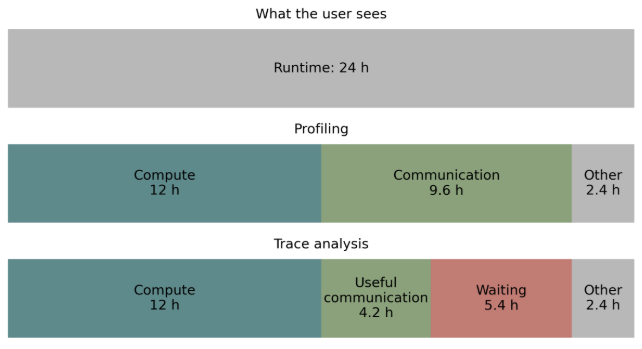
Figure 3 compares the information provided by profiling and trace analysis. A profile may show that communication accounts for a large fraction of the runtime. Trace analysis reveals that much of this time is spent waiting for slower processes rather than performing useful communication.
Tools such as Scalasca can analyse trace data, identifying waiting states, communication overheads, and load imbalance. This helps researchers understand the underlying cause of a bottleneck.
Looking inside the computation
Communication is not always the main cause of poor performance. Performance also depends on how efficiently the processor executes the underlying computations. Factors such as memory access patterns, vectorisation, and cache usage can have a significant impact on runtime, even when an application scales well across multiple processors.
MAQAO analyses a compiled application and reports how effectively different parts of the code use the available hardware. It can identify loops that are difficult to vectorise, highlight inefficient memory access patterns and estimate the performance improvements that might be achieved through optimisation.
Figure 4 summarises the results of analysing the test application. Several loops show substantial optimisation potential, indicating where development effort is most likely to deliver performance gains. The estimated speedups represent idealised upper limits, providing a guide to which parts of the code are worth investigating further.
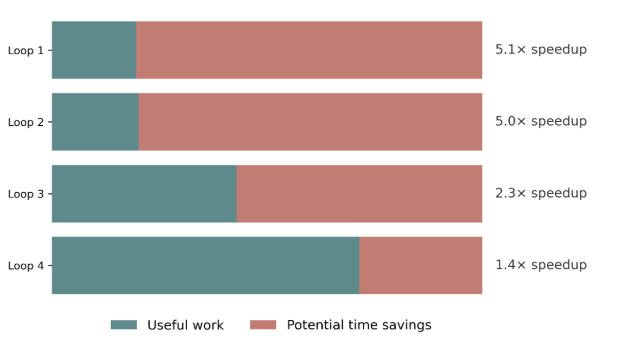
Together, profiling, trace analysis, and processor-level analysis provide a complete picture of application performance. They can help researchers identify bottlenecks, understand their causes and target optimisation effort where it is likely to have the greatest impact.
Scaling behaviour
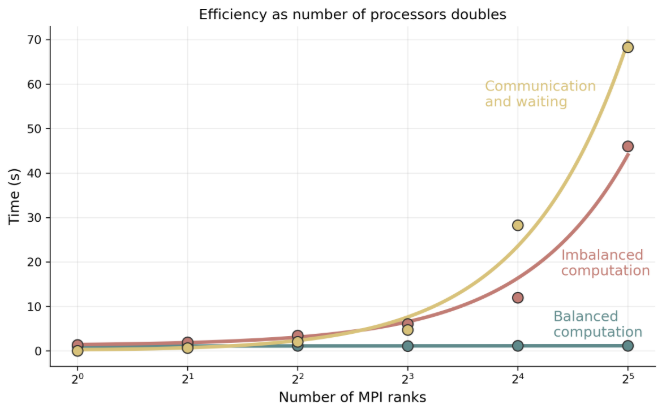
Researchers also need to understand how an application will behave as simulations become larger or as more computational resources are used. To explore this, we analysed the test application at a range of processor counts. Measurements were collected for the balanced computation, the deliberately imbalanced computation and the communication phase.
Extra-P uses these measurements to build mathematical models describing how different regions of an application scale. These models can be used to predict performance at larger scales and identify components that may become future bottlenecks.
Figure 5 shows the scaling models produced from the performance measurements. The balanced computation scales well, while the imbalanced computation and communication phases become increasingly expensive as the number of MPI ranks increases. By modelling how different parts of an application scale, researchers can anticipate future bottlenecks and make more informed decisions about code development and resource use.
Conclusion
Improving performance is not only about reducing runtime. More efficient applications can also make better use of shared computing resources and reduce energy consumption.
The tools discussed in this article help answer different questions about application performance, from identifying bottlenecks to understanding scalability. They provide practical insights that can improve application performance, reduce wasted computation and support more efficient and sustainable use of HPC resources.
Ready to optimise your code?
The tools used in this article are Score-P, Scalasca, MAQAO, and Extra-P. All are available for free download, with guidance available from VI-HPS, the Virtual Institute for High Productivity Supercomputing.
We may be able to offer more hands-on support for performance optimisation through a costed RSE engagement. To discuss your project, log a Research Computing query.
We also support code optimisation and parallelisation through our SWD training courses.